

Power BI is a comprehensive set of Business Intelligence class data analysis tools, available in both on-premise and cloud models. They allow intuitive visualization and in-depth analysis of data collected throughout the organizational structure by all authorized people in each department. As a Microsoft partner, we implement Power BI and tailor it to the real business needs of companies.
Power BI allows you to combine data from multiple sources - databases, files, folders, Azure service or web services. This saves you time and eliminates the risk of missing important business information. They are available 24/7 to everyone working on a project. As part of Power BI implementations carried out as a certified Microsoft partner, we help companies securely integrate this data into a single environment.
The advanced data visualisation available in Power BI facilitates data analysis and minimises the time needed to generate reports containing key metrics. Importantly, data summaries prepared in this way can be shared with other employees or presented to contractors.
200 +
completed implementations500 +
satisfied customers1000 +
developed analyses10000 +
trained customersWith Microsoft’s Power BI tool, you can connect to a variety of data sources and perform ad hoc analyses. Creating visually appealing reports, publishing them, and sharing them online and on mobile devices takes just a few moments.
Copilot AI is a state-of-the-art Power BI extension that enables the use of artificial intelligence to make working with data even faster and more intuitive, even for those without advanced analytical knowledge. As a Microsoft Partner, we help companies securely leverage these capabilities in their production environment.
The function enables automatic generation of conclusions from the data: it shows changes, anomalies, and trends in a way that is accessible to the business user.
Copilot recommends which data are worth exploring further - pointing out potential correlations, key variables or untapped data sources.
With Copilot, sales, marketing or HR teams can analyze data and create reports on their own, without the help of IT or BI analysts.
Implementing Power BI is not just a new reporting system – it’s a real change in the way you make decisions, manage your business and optimize your operations. Here are the specific, measurable benefits you can achieve:
By automating reporting from multiple sources (e.g. ERP, CRM, Excel), report preparation time can be reduced from days to hours. Instead of “manually gluing data,” reports update automatically when data is refreshed.
During a Power BI implementation, we will show you how to build. Instead of waiting for monthly reports, management teams have access to real-time data, allowing them to make decisions much faster, often the same day. Data that will be the basis for analysis. We'll define relationships between tables, create calculations and measures to help generate accurate reports.
Instead of sending Excel files by email, users can access the same, up-to-date data in Power BI - saving up to 5-10 hours a week in communication and information sharing.
Better visibility into costs and margins (e.g., at the level of products, departments or sales channels) makes it possible to identify areas for optimization - for example, by reducing unprofitable marketing activities or cutting logistics losses.
Thanks to the centralization of data in one place and the ability to create dashboards for different departments (e.g., finance, HR, sales, production), all teams operate with a single, consistent version of data.
With detailed permissions and integration with Microsoft Entra (Azure AD), you can precisely manage who sees what data - reducing the risk of errors and information leaks.
Business data is a key element for companies that want to stay ahead of the competition. With the help of modern tools such as Power BI, you can speed up their analysis, and the information obtained will be used to make better business decisions. What additional benefits come with implementing Microsoft Power BI?
The first step is a thorough analysis of the needs and objectives of implementing Power BI. Together, we will determine what data you want to analyze, what reports and indicators your organization needs, and what the main goal of the project will be.
During the implementation of Power BI, we will show you how to build data models that will form the basis for analysis. We will define relationships between tables and create calculations and measures that will help you generate accurate reports.
After creating reports, we will show you how to publish and share them so that other users can access them online. We will show you how to manage permissions and access rights, and we will draw your attention to appropriate data security measures.
Data preparation is a key step. With Power BI, you can aggregate data from various sources, such as databases, spreadsheets, or CSV files, in one place, and then filter and segment it so that it is ready for visualization.
Based on the data model, we will create a variety of reports and visualizations. We will use Microsoft Power BI to create interactive charts, tables, maps, and graphs that will enable users to easily analyze data.
After implementing Power BI, our consultants will remain at your disposal and provide expert support during training and development of the Business Intelligence system. As a Microsoft Gold Partner, we guarantee professionalism and high quality services.


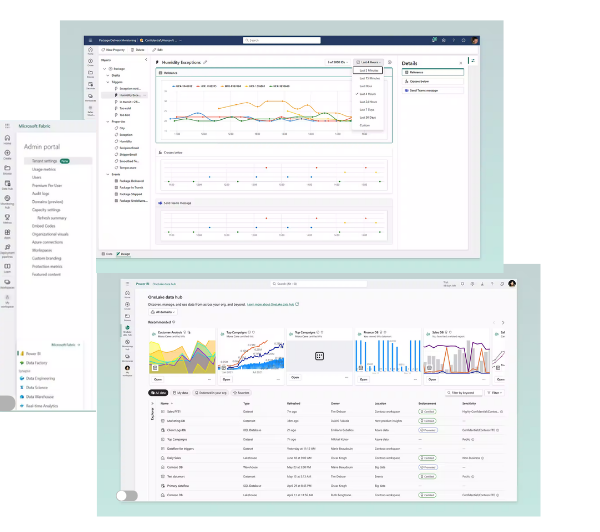
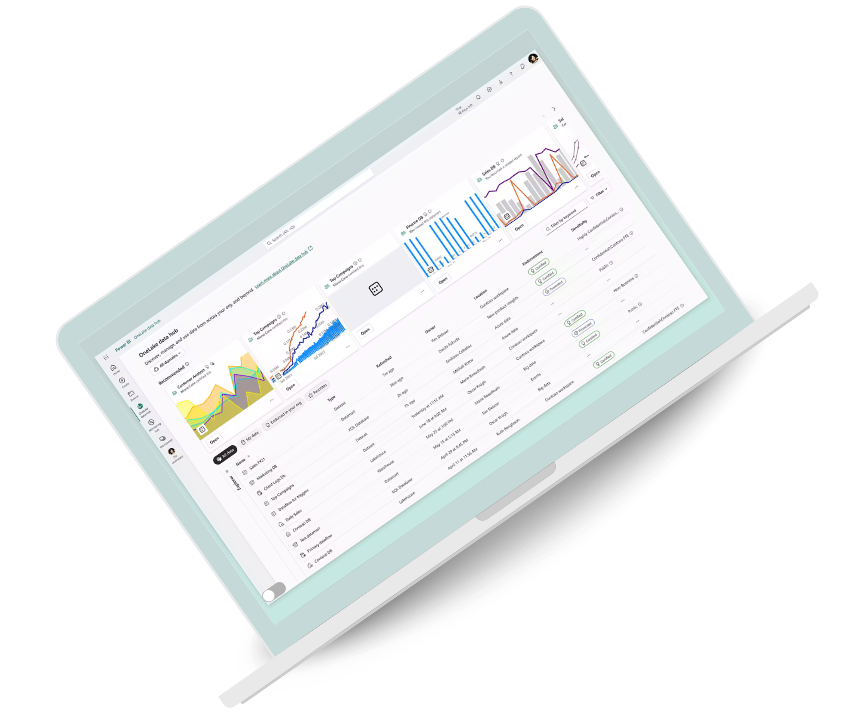
Meet Microsoft Fabric - an innovative all-in-one analytics platform that integrates Power BI, Azure Synapse and Azure Data Factory.
Discover how Microsoft Fabric, an advanced analytics platform based on artificial intelligence, is revolutionising data analysis.
The current business market poses many challenges for companies, and one of the key elements for success is the skilful use of available data.
Microsoft Fabric is an advanced tool that revolutionizes data analytics – including real-time analytics, combining various Microsoft services into one comprehensive platform. With a full suite of services, from Power BI to Data Factory, and a Real Time Analytics module, the tool enables companies to respond quickly to changing business conditions. Find out what Real […]
In the dynamic landscape of data-driven decision-making, Microsoft Fabric introduces a game-changing tool – the Data Activator. This no-code experience redefines how businesses automatically respond to evolving data patterns and conditions. Let’s explore how Data Activator revolutionises the business landscape, enabling users to create a digital nervous system that acts across all data sources in […]
In the ever-evolving landscape of data analytics, staying ahead of the curve is crucial for businesses striving to harness the power of information effectively. As we enter 2024, a new era of data analytics unfolds, promising innovative methodologies and cutting-edge tools. Let’s delve into the five emerging trends shaping the data analytics landscape and explore […]
In today’s dynamic business landscape, harnessing the full potential of data is no longer a luxury but a necessity. As organisations grapple with vast amounts of data from diverse sources, having a comprehensive tool that seamlessly integrates various services becomes paramount. Enter Microsoft Fabric – a revolutionary platform that converges data lake, data engineering, data […]
In business analytics and data processing, Microsoft has implemented several tools that effectively respond to the diverse needs of companies. Despite the long-standing popularity of the Power BI service among business users across various sectors, Microsoft’s new platform, Fabric, has ambitions to gain even more market share. What is the difference between Microsoft Fabric and […]