


In the world of data analysis, choosing the right tool is crucial to the success of any organization. Microsoft offers two powerful solutions – Fabric and Power BI – which, although they share a common goal, differ significantly in terms of functionality, technical requirements and applications.
In this article, we will discuss the key differences between Microsoft Fabric and Power BI, helping you understand which of these tools will best meet your analytical needs.
What is Microsoft Fabric?
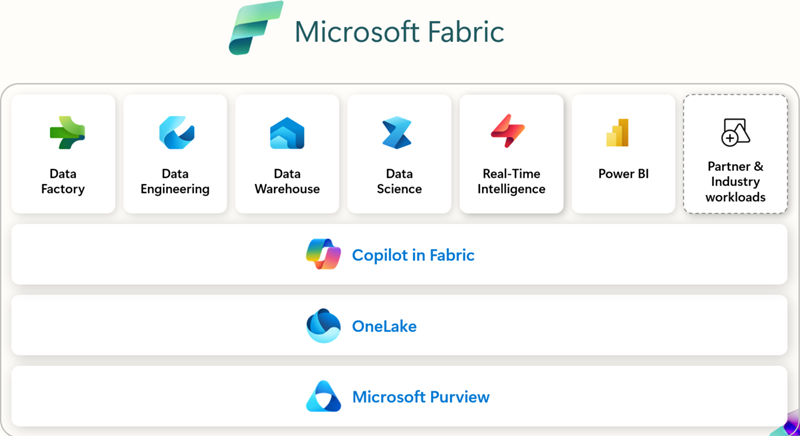
Microsoft Fabric is an end-to-end data analytics platform that integrates a number of tools and services in one place. This includes, among others:
- Data Warehouse – used to store and process data for analysis.
- Data Science – tools for creating and implementing machine learning models.
- Synapse Data Engineering – allows you to build and optimize infrastructure for collecting, storing, processing and analyzing large amounts of data.
- Data Factory – a data integration environment that allows you to acquire, prepare and transform data from various sources.
- Data Activator – a tool that allows you to specify actions such as email notifications and Power Automate flows.
- Real-Time Intelligence – supports real-time ingestion, transformation, storage, analysis, visualization and artificial intelligence.
- Power BI – a tool for creating data visualizations.
Microsoft Fabric aims to make it easier for organizations to manage, analyze and use data to make better business decisions. The platform offers a number of features that facilitate collaboration between teams, ensure scalability and data security.
What is Power BI?
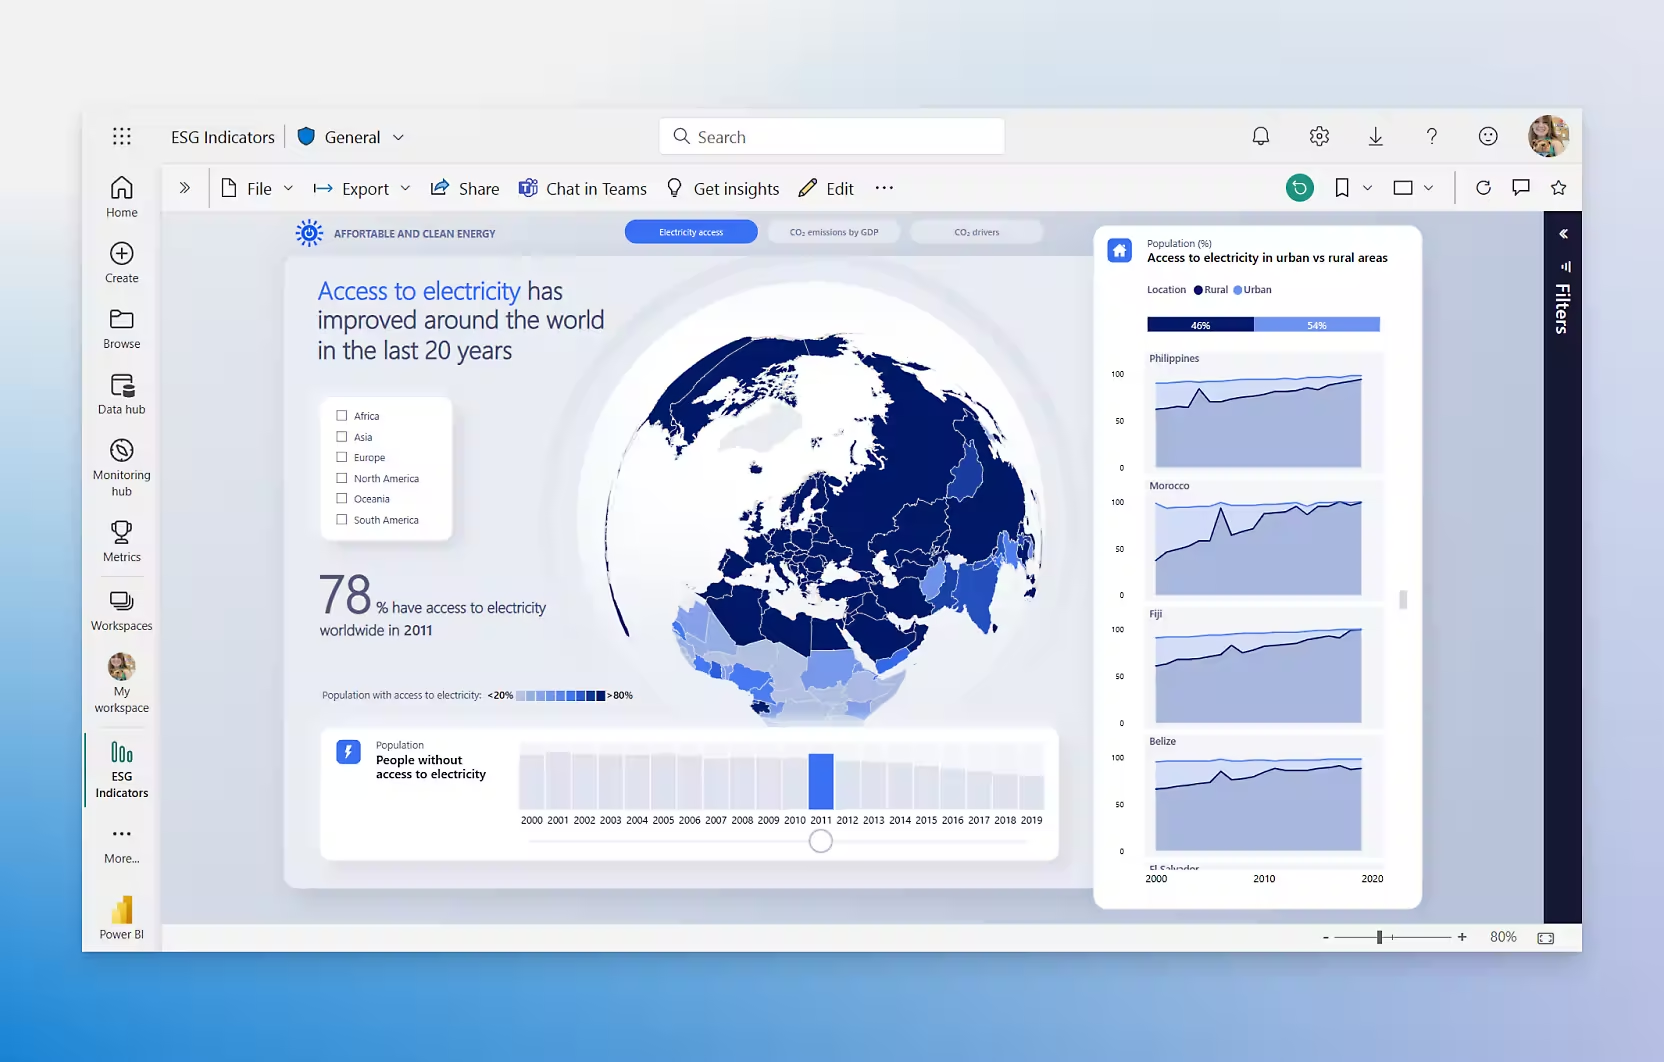
Power BI is a powerful business intelligence (BI) and data visualization tool developed by Microsoft. It enables users to analyze data, create interactive reports, and build dynamic dashboards that provide valuable insights into business performance. With its intuitive interface and robust analytics capabilities, Power BI allows organizations to turn raw data into meaningful information, helping teams make data-driven decisions efficiently.
Key Features of Power BI:
- Data connectivity – Power BI supports integration with a wide range of data sources, including Excel, SQL Server, Azure, Google Analytics, and third-party applications such as Salesforce and SAP. This flexibility enables businesses to consolidate data from multiple sources into a single, comprehensive view.
- Interactive dashboards – users can create highly visual, interactive dashboards that allow for deep exploration of data through drill-downs, slicers, and filters.
- Real-time data analysis – with live data connections and scheduled refresh options, Power BI ensures that reports always display up-to-date information. This is particularly useful for monitoring key performance indicators (KPIs) and operational metrics in real-time.
- AI-powered insights – Power BI incorporates artificial intelligence (AI) features such as automated pattern detection, natural language querying (Q&A), and predictive analytics, helping users uncover trends and anomalies in data.
- Collaboration and sharing – Power BI facilitates seamless collaboration by allowing users to share reports and dashboards across teams. Reports can be published to the Power BI Service, embedded in applications, or integrated with Microsoft Teams and SharePoint.
Custom visuals and personalization – users can customize reports with a variety of built-in visualizations or create their own using Power BI’s open-source visualization framework.
Differences between Microsoft Fabric and Microsoft Power BI
The biggest difference between Microsoft Fabric and Power BI is that Fabric offers a wider range of features including data storage, data processing, data science and business intelligence, while Power BI focuses on creating data visualizations and is one of the service environments Fabric.Many organizations evaluate the cost of Power BI vs. the cost of Fabric when deciding which tool best suits their needs.
Technical skills necessary to use
When choosing the right tool, it is important to consider the level of technical skill required to operate it. Power BI and Fabric have varying degrees of complexity, which affects who can use them effectively.
Power BI is designed for a wide range of users.
A person using Power BI should have basic data analysis concepts and have spreadsheet skills, such as: Microsoft Excel. Power BI offers an intuitive drag and drop interface that makes it easy to create simple reports and data visualizations.
Built-in features and templates make work easier, and users can learn to use the tool with extensive documentation, tutorials, and training resources available online. Users can also use Power Query to transform data and create simple queries without the need to know SQL.
Fabric is a more advanced tool requiring technical expertise.
A person working with Fabric should have a solid foundation in programming and data management. Knowledge of programming/query languages such as Python or SQL is required, as well as skills in working with large data sets and analytical and statistical techniques.
Fabric is a tool designed for data scientists, data analysts and data engineers who need to create, process and analyze data on a large scale. Working with Fabric may also require knowledge of cloud data management tools and platforms and the ability to configure and optimize computing environments.
When to choose Power BI vs. Microsoft Fabric?
Choosing between Power BI and Microsoft Fabric depends on your organization’s specific needs, size, resources, and analytical sophistication. Here are clear guidelines to help you make the right decision:
Power BI – ideal for:
Small and Medium-sized enterprises (SMEs):
- Companies needing an intuitive tool for data visualization and report creation.
- Teams wanting to quickly gain data insights without advanced technical skills.
- Companies using various data sources like Excel, CSV, or SQL Server.
Rapid reporting and analysis:
- When the priority is quick report and data visualization creation.
- For data analysis that doesn’t require complex transformations and processing.
Microsoft Fabric – ideal for:
Large enterprises:
- Companies working with large datasets needing a comprehensive data analytics platform.
- Organizations needing an integrated environment for data processing, warehousing, and analysis.
- Companies wanting to use advanced analytics techniques like machine learning and real-time analysis.
Advanced data processing:
- When large-volume data processing, diverse source integration, and advanced analytical model building are required.
- When a comprehensive environment combining data engineering, data science, and business intelligence tools is needed.
Pricing and Licensing Models
Many companies rely on Power BI and Fabric to gain real-time business insights, ensure data consistency, and make better strategic decisions. The cost of Power BI is often lower for small teams focused on reporting, while the cost of Fabric can be justified for enterprises requiring comprehensive data solutions. Evaluating the benefits of each tool can help determine the right solution for your business.
Microsoft Fabric cost
Microsoft Fabric offers flexible licensing models based on cloud resource usage and organizational needs. Pricing is typically determined by the number of users and resource consumption, such as computing power and data storage. Licensing can be more complex due to the platform’s extensive structure, but it provides more scalable solutions.
Power BI cost
Power BI is available in three main licensing options:
- Power BI Free – a free version, limited to individual use.
- Power BI Pro – around $10 per user per month, offering full functionality for report sharing and collaboration.
- Power BI Premium – starting at approximately $20 per user per month, designed for organizations requiring greater computing power, advanced AI features, and dedicated cloud resources.
Outsourcing BI services
It is possible to outsource BI services if you lack internal resources or skills. EBIS offers support in, among others in system implementations and in creating reports with both Power BI and Fabric, which allows you to fully use the capabilities of these tools without the need to have advanced technical knowledge in the organization.
If you need help implementing BI tools or are looking for a company that will comprehensively prepare reports and analyze your company’s data – contact us!