

A few years ago, data analysis in companies was based on a few ERP reports and an Excel file. Today, the situation looks completely different. Organizations simultaneously use ERP and CRM systems, financial and accounting systems, marketing automation tools, e‑commerce platforms, Excel files, IoT data, cloud services, and SaaS applications. Each of these sources generates valuable information. The problem arises when data remains scattered.
This is why more and more organizations ask one key question:
Does our company operate on a single source of truth?
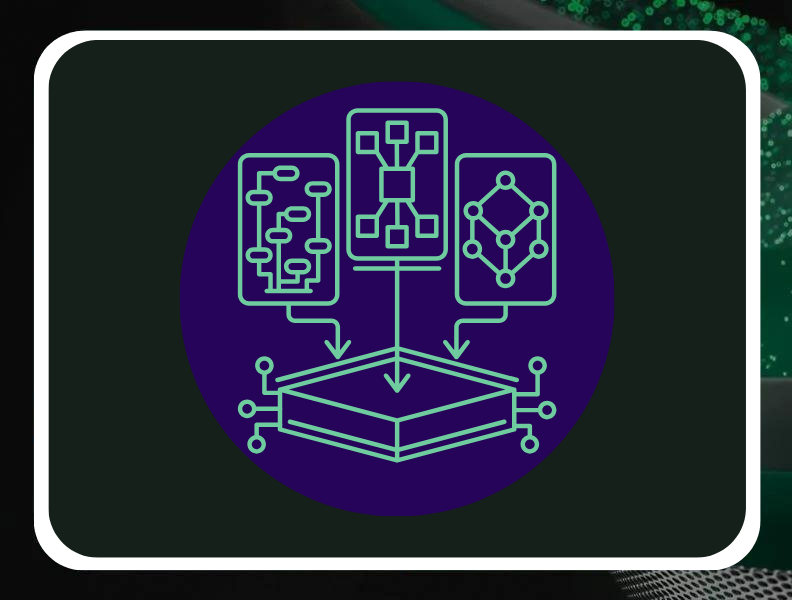
The answer to this challenge is a unified data analytics platform—a cohesive environment that integrates all analytical components in one place.
What Is a Unified Data Analytics Platform? – Definition and Key Assumptions
A unified data analytics platform is an integrated technological environment that combines all essential areas of working with data within a single architecture.
It includes:
- integration of data from various sources,
- data processing (ETL/ELT),
- data storage (data warehouse / lakehouse),
- data analysis and modeling,
- reporting and Business Intelligence,
- data science and advanced analytics,
- data governance and security management.
Instead of many separate tools, the organization uses one consistent ecosystem.
Key Characteristics of a Unified Data Analytics Platform
To be considered truly unified, the platform should provide:
- a single architecture—a shared data and processing layer,
- a unified workspace—for data engineers, analysts, and business users,
- one security model—centralized permission management,
- centralized access and governance—control over data quality and consistency.
This approach eliminates the need to integrate multiple independent components and reduces architectural risk.
What Problems Does a Unified Analytics Platform Solve?
Implementing a unified data analytics platform is not only about organizing IT architecture. It primarily addresses real business problems that arise as the organization grows and the number of data sources increases.
Eliminating Data Duplication
In a fragmented environment, the same data is often:
- copied into multiple databases,
- processed in different tools,
- stored in various versions.
A unified analytics platform introduces a central data repository, reducing redundancy and minimizing the risk of errors.
Consistent KPI Definitions Across the Entire Organization
One of the biggest challenges in reporting is the lack of unified KPI definitions.
A unified data analytics platform enables:
- centralized data modeling,
- standardized indicator definitions,
- building one reporting model for the entire organization.
The result? Management, finance, and sales analyze the same numbers—in the same way.
Shortening Report Preparation Time
Manual merging of Excel files and fixing data before a board meeting is still a daily struggle for many companies.
A unified platform:
- automates data integration processes,
- updates reports in real time,
- eliminates manual operations.
As a result, reporting stops being a project and becomes a continuous part of the decision‑making process.
Simplified Security and Compliance Management
Distributed tools mean distributed permissions and higher risk of breaches.
A unified data analytics platform provides:
- centralized access management,
- control over permission levels,
- compliance with regulations (e.g., GDPR),
- full data usage audit.
This is especially important for organizations handling financial and sensitive data.
Key Components of a Unified Data Analytics Platform
To effectively support business analytics, the platform must include several critical components.
Data Integration
The first step is efficiently connecting data from different systems. The platform should enable:
- integration of ERP, CRM, finance, and marketing data,
- automation of ETL/ELT processes,
- handling both structured and unstructured data.
Data Warehouse / Lakehouse
The central data repository is the heart of the entire architecture. It should ensure:
- a single source of truth,
- high query performance,
- cloud scalability,
- support for both warehouse and lakehouse paradigms.
A modern unified platform combines the flexibility of a data lake with the structure of a data warehouse.
Analytics and BI Layer
Data only has value when it can be analyzed.
The BI layer includes:
- data modeling,
- building dashboards and interactive reports,
- self‑service BI for business users.
Data Science and AI
More and more companies are moving beyond standard reporting.
A unified platform should enable:
- advanced predictive analytics,
- integration with machine learning tools,
- collaboration between data science and BI teams in a single environment.
Governance and Security
Without data control, there is no mature analytics.
Key governance elements include:
- centralized permission management,
- monitoring data usage,
- version control for models and reports,
- compliance with security policies and regulations.
These are the elements that distinguish a random reporting setup from a professional unified data analytics platform that supports organizational growth.
Examples of Unified Data Analytics Platforms on the Market
The market offers several solutions described as unified data analytics platforms. They differ in the level of integration, architecture, and readiness to support the full analytical process—from data integration to executive reporting.
Microsoft Fabric
Microsoft Fabric is a comprehensive, integrated analytics platform that brings together in one environment:
- Data Factory,
- Lakehouse,
- Data Warehouse,
- Power BI,
- Real-Time Analytics,
- Data Science.
What distinguishes Microsoft Fabric includes:
- a single licensing model,
- one workspace,
- unified capacity and cost management,
- deep integration with Azure, Microsoft 365, and Microsoft Teams.
For organizations already using Power BI, Fabric becomes its natural extension—without the need to build additional, complex architecture.
Advantages of Microsoft Fabric
- full end-to-end integration in one ecosystem,
- no need to combine many independent services,
- simplified deployment within the Microsoft environment,
- unified lakehouse and warehouse architecture,
- a single security model.
In practice, this means shorter implementation time and lower risk of integration errors.
Databricks
Databricks is a very strong environment for data science teams and data engineers.
It is characterized by:
- high flexibility,
- strong support for working with large datasets,
- advanced ML capabilities.
At the same time:
- it requires additional configuration to support a complete BI layer,
- a separate reporting tool is often needed,
- it is better suited to advanced technical teams than to a wide group of business users.
Compared with Microsoft Fabric, Databricks does not offer such a cohesive, native connection between data science and Business Intelligence within a single, centrally managed environment.
Google BigQuery + Looker
Google BigQuery combined with Looker creates a scalable cloud environment within Google Cloud.
Advantages:
- high data processing performance,
- good integration within Google Cloud.
However:
- individual functions operate as separate components,
- integration with Microsoft tools is limited,
- the environment is less natural for organizations using Power BI and Microsoft 365.
In practice, for many European companies deeply rooted in the Microsoft ecosystem, Microsoft Fabric is a more consistent and easier-to-implement solution.
Why Is Microsoft Fabric Currently the Most Comprehensive Unified Data Analytics Platform?
Compared to competing solutions, Microsoft Fabric stands out for its level of integration and completeness.
It provides one environment for:
- data engineers,
- analysts,
- BI teams,
- data scientists,
- finance and operations departments.
Key Advantages:
- full integration with Power BI,
- lakehouse and data warehouse within one architecture,
- unified security and access management model,
- centralized capacity and cost management,
- scalability in the Azure cloud.
Most importantly, Microsoft Fabric shortens the path from raw data to executive dashboards. All elements—from integration, through transformation, to reporting—operate within one ecosystem.
This level of cohesion makes Fabric the most mature unified data analytics platform currently available in the enterprise environment.
Do You Want to Check Whether a Unified Data Analytics Platform Makes Sense in Your Organization?
If:
- you work with many different data sources,
- reports across departments display different values,
- the process of preparing analyses is time-consuming and manual,
- you are considering implementing Microsoft Fabric or expanding your Power BI environment,
then it is worth starting with an assessment of your current data architecture.
At EBIS:
- we compare data from various systems (ERP, CRM, finance, marketing),
- we design a unified architecture based on Microsoft Fabric and Power BI,
- we implement data warehouses and lakehouse solutions,
- we build executive dashboards aligned with real business needs.
Contact us to discuss what your target unified data analytics platform could look like and how to move from fragmented tools to one cohesive decision-making environment.